African Sovereign Market Curve
Updated:
July 24th, 2026
How Do You Interpret the Yield Curve?
The shape of the Treasury yield curve is typically upward sloping, meaning that debts with longer terms tend to come with higher interest rates than those with shorter terms. Ahead of an economic recession, the curve tends to become flatter, and may eventually invert so that short-term rates surpass long-term rates.
The Daily Treasury Yield Curve Rates, also known as “Constant Maturity Treasury” rates are interpolated by the Treasury based on the daily yield curve, which is calculated from composite market quotations of actively traded Treasury securities in the over-the-counter market obtained by the Federal Reserve Bank of New York.
Representative Sovereign Rate Profile — Illustrative Market View
| Maturity | Rate |
|---|---|
| 4 weeks | 3.77% |
| 8 weeks | 3.86% |
| 13 weeks | 3.90% |
| 17 weeks | 3.97% |
| 26 weeks | 4.04% |
| 52 weeks | 4.12% |
What Is a Treasury Yield Curve?
The sovereign treasury yield curve is a visual representation that displays the interest rates of US government debt instruments based on the length of time until they mature. By plotting the yields against different maturities, the graph allows individuals to understand the amount of interest the government must pay back for various time frames and also gives insight into the current and expected macroeconomic environment.
Earn Yields of 4.24%* and Higher
Explore African sovereign markets, corporate debt, and settlement workflows through one connected desk. Availability, providers, safeguards, and terms vary by market and participant.
Normal Vs Inverted Curve
Historical Treasury Yield Spread (10Y - 1Y)
An inverted yield curve occurs when long-term yield rates are lower than short-term rates and is often a precursor to a recession, having preceded nearly all recessions since 1960 by about a year. Financial markets can be impacted by inverted yield curves. During times of economic turbulence, traders may flock to purchase longer-dated debt instruments if they anticipate interest rates falling over the short term due to the Fed lowering rates to combat economic weakness.
A normal yield curve shows higher rates for long-term debt instruments, which generally indicates confidence in the economy. An upward-sloping yield predicts higher interest rates across financial markets. The normal yield curve is considered more robust in predicting market conditions compared to other market indicators and variables by financial analysts.
How Does the Treasury Yield Work?
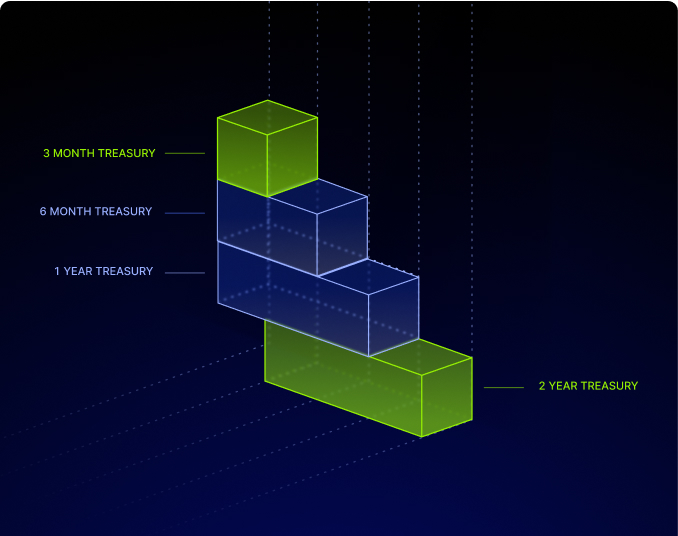
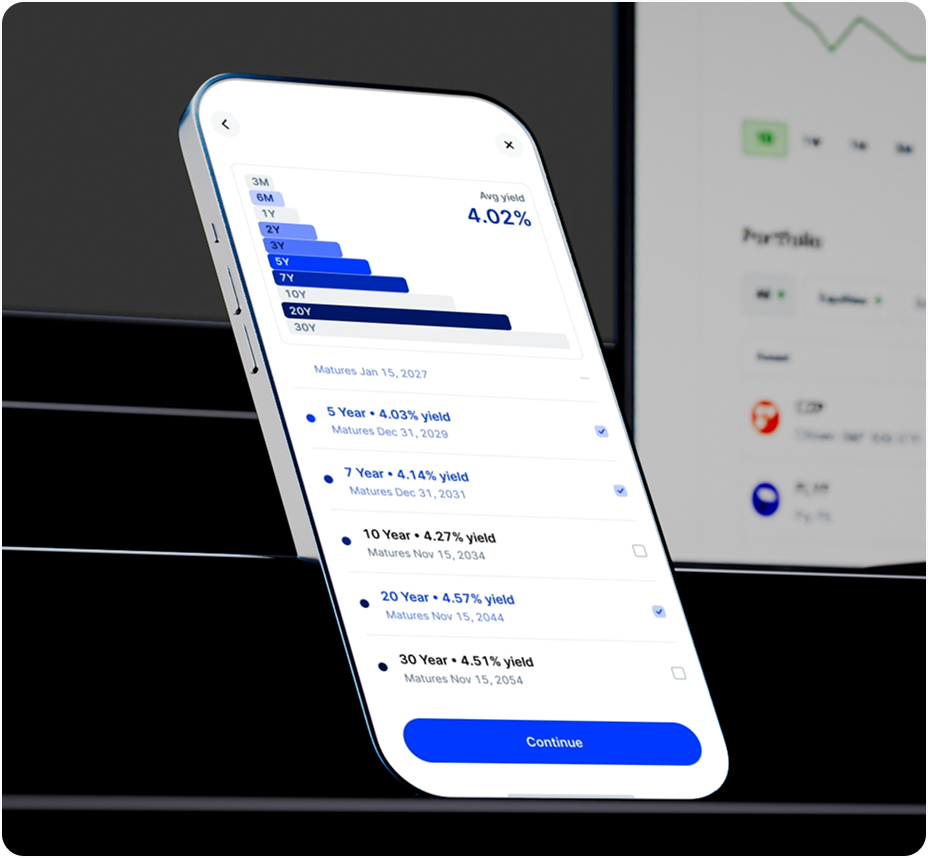
When you trade in a Treasury Account on GTCX TradeDesk, your money is allocated across a ladder of up to ten African sovereign markets with staggered maturity dates. Each Treasury is purchased at a discount and pays out its full face value at maturity. Your yield is the difference between what you paid and what you receive.
On GTCX TradeDesk, you can choose from a range of pre-built ladders—or build your own by selecting the specific maturities that match your financial goals.
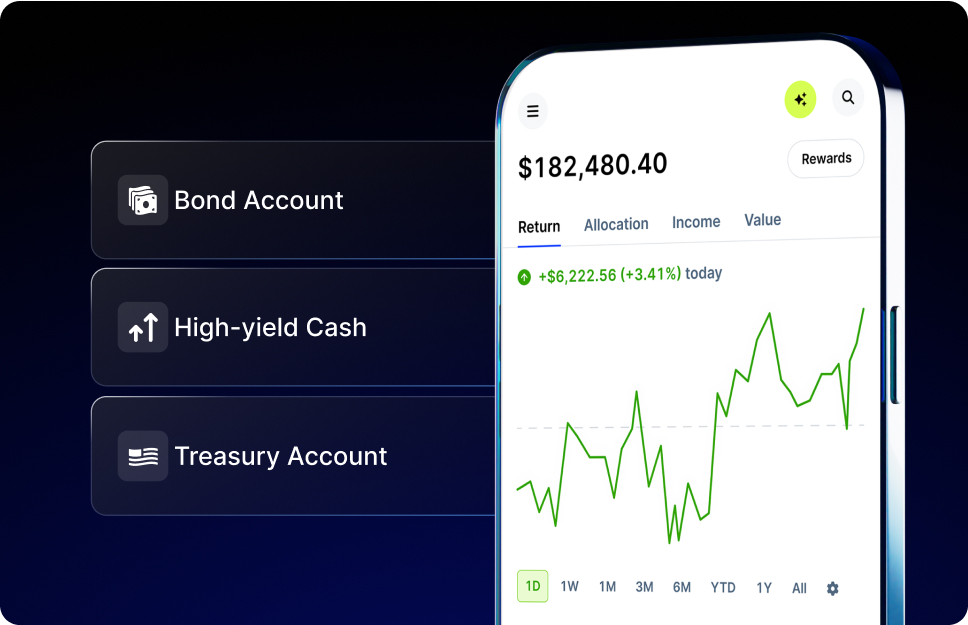
Looking for More Ways to Generate Yield?
Discover more yield-generating market instruments on GTCX TradeDesk.
Treasury Account* 4.24%
Trade in sovereign treasury bills with a 4.24% yield, and pay no state and local taxes on your earnings
Learn More
Debt Markets
Find, evaluate, and buy corporate and Treasury debt instruments with a trading experience designed this century.
Learn More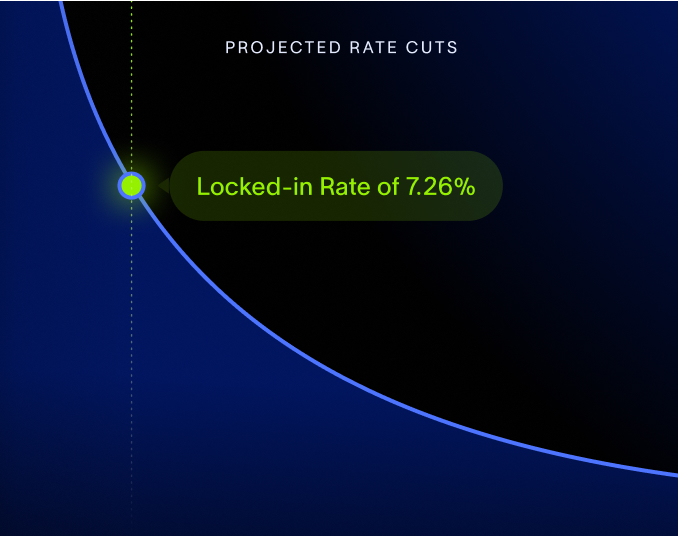
Commodities & Offtake** 7.3%
Maximize your return with a diversified book of corporate debt that generate a 7.3% yield.
Learn MoreRelation Between the Treasury Yield Curve and the Listed Equity Market
The sovereign treasury yield curve is a visual representation that displays the interest rates of US government debt instruments based on the length of time until they mature. By plotting the yields against different maturities, the graph allows individuals to understand the amount of interest the government must pay back for various time frames and also gives insight into the government's borrowing plans.
The shape of the yield curve can be a strong indicator of the overall health of the economy, with an inverted yield curve often considered a sign of an impending recession.
How Interest Rates Affect Listed Equity Market
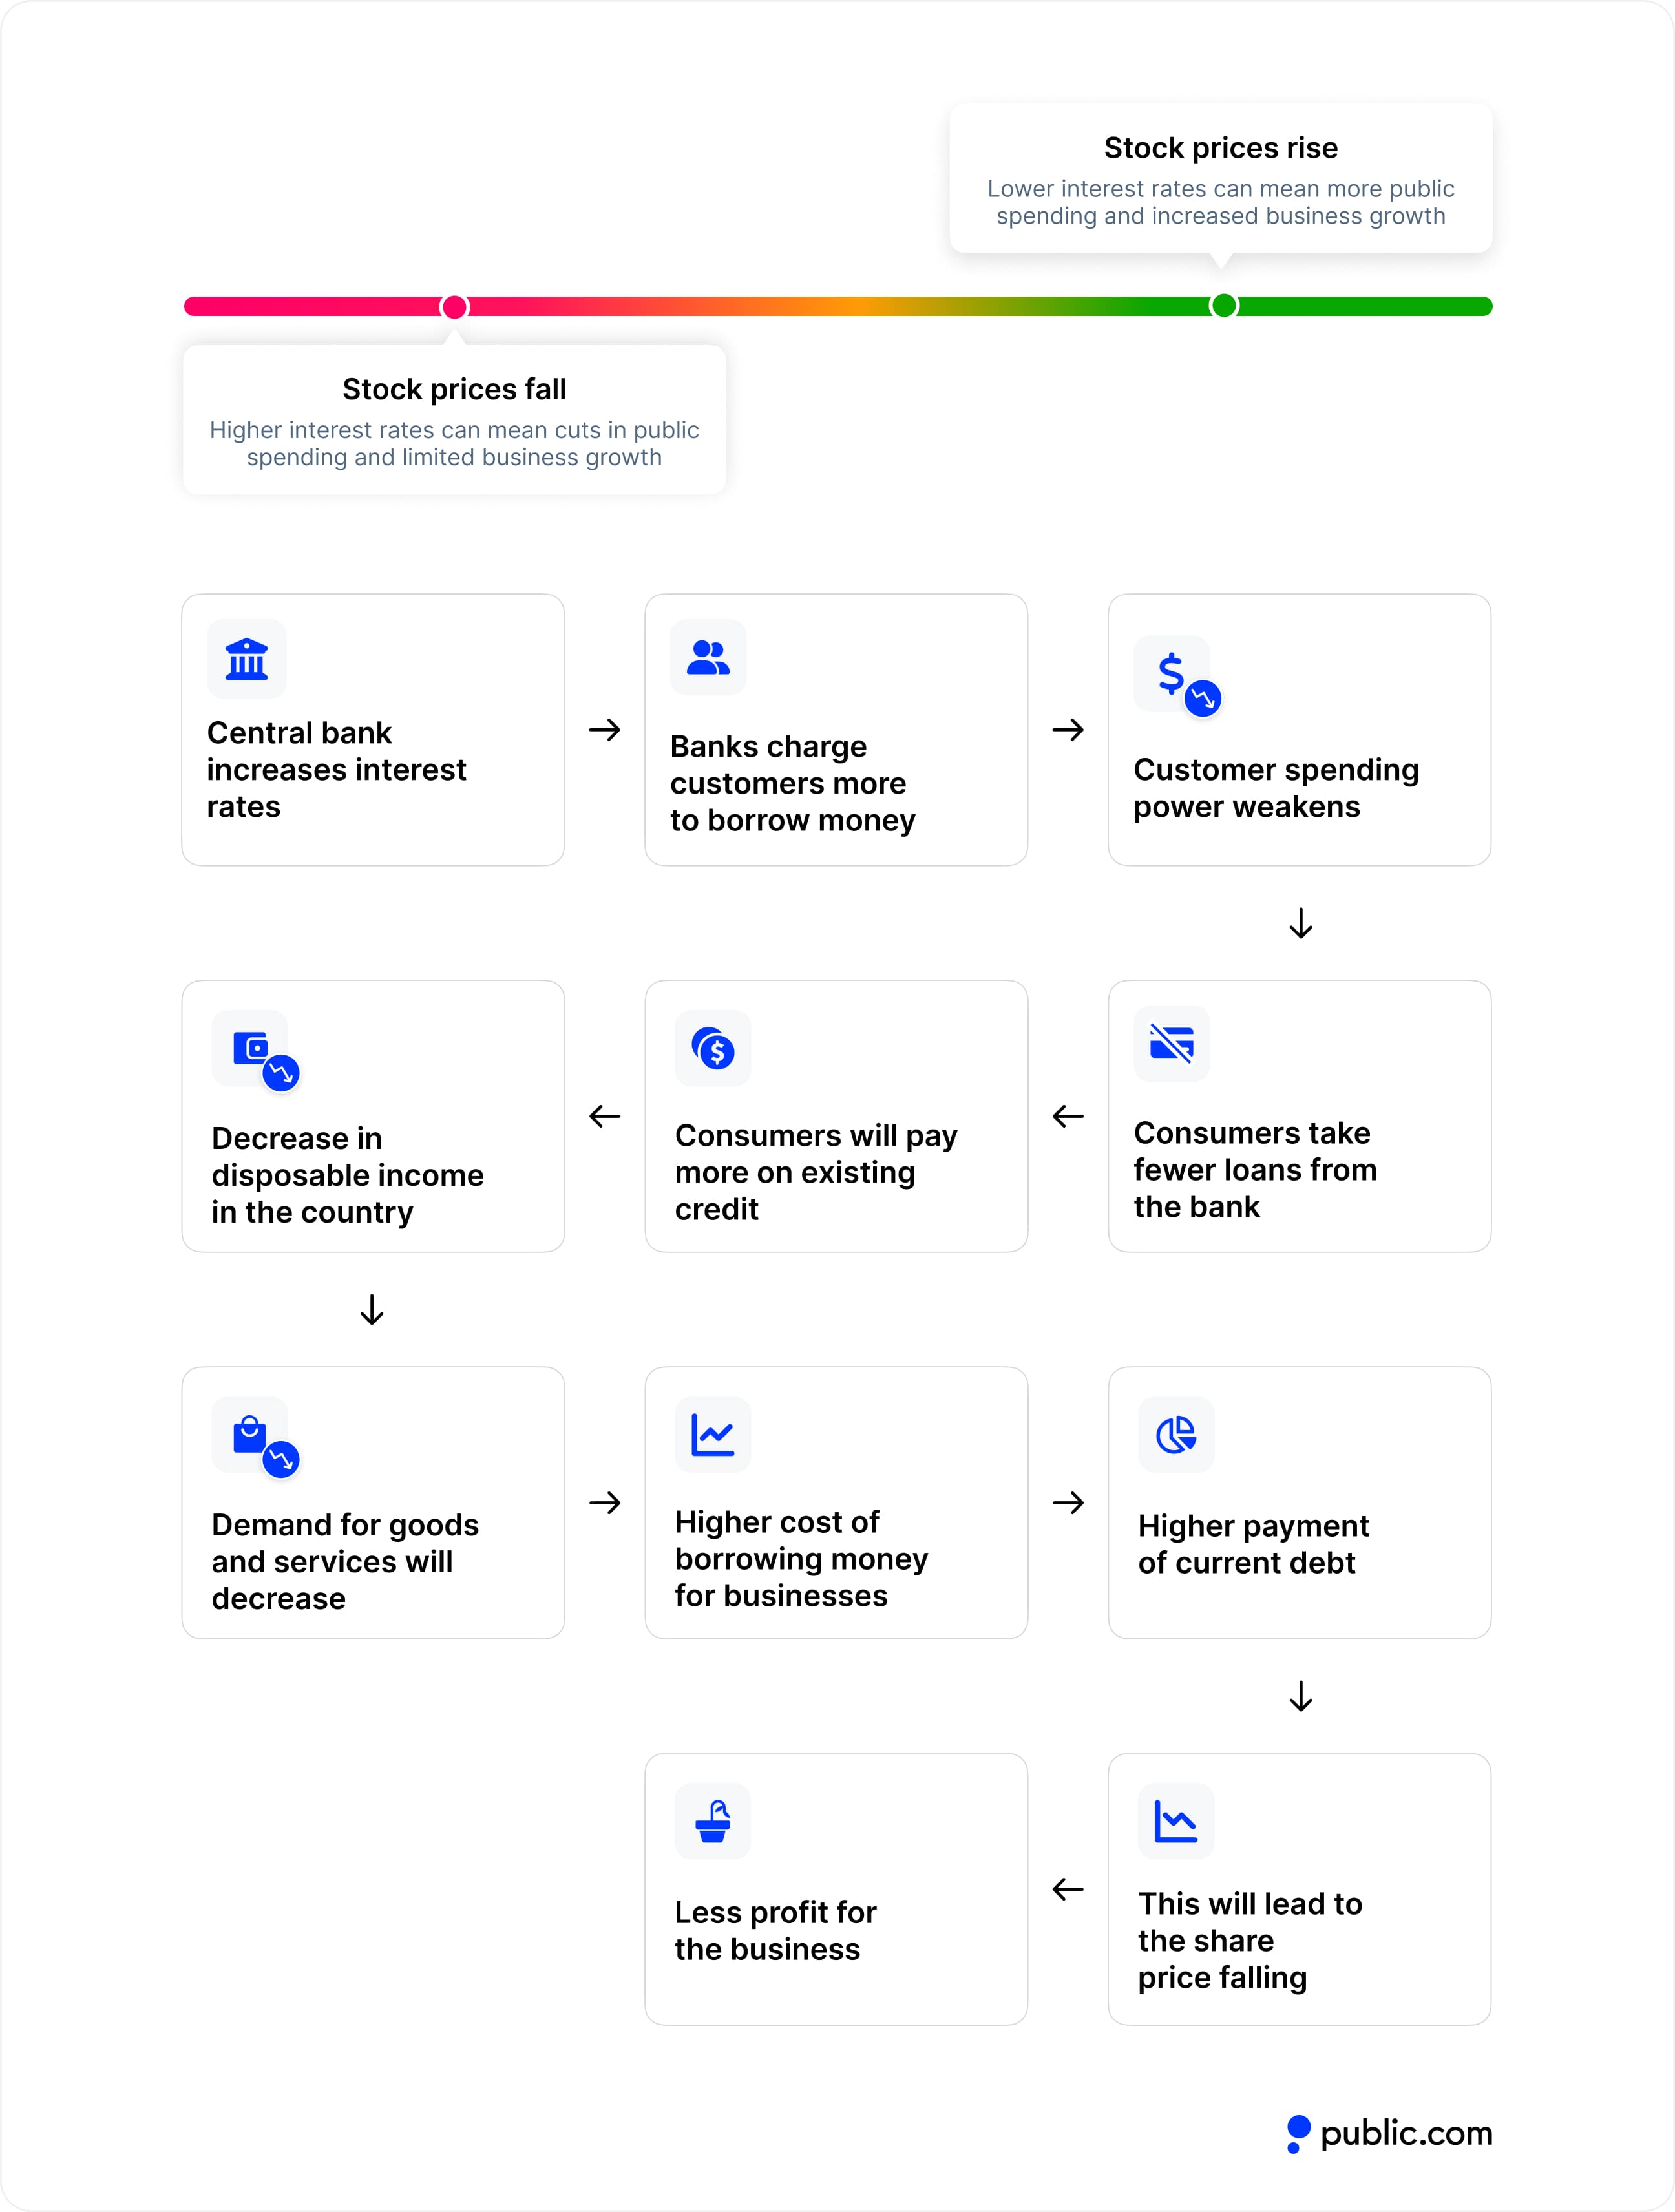
The relationship between interest rates and listed equities is generally inverse. While changes in interest rates may take time to manifest throughout the economy, listed equity market movements are prompt in response. The reason for this is that interest rate fluctuations alter the value of a future dollar, which impacts the current value of a company’s future profits. In a rising rate environment, future dollars are worth less and in turn, future profits are worth less, so today’s company value must decline to reflect that drop in future value. This decline is not because the company is doing worse, but solely because interest rates have changed.
A rise in interest rates means a reduction in spending power for consumers. The higher credit rates discourage consumers from taking loans with their limited funds and they often must pay more on existing debt. This trickles down to businesses where the cost of borrowing becomes more expensive, including higher debt repayments. This shift in repayment plans leads to decreased profit, lower position spending, and potentially lower listed equity prices as a result. The faster and more aggressive the rate increases, the more impact they will have on these factors.
How to Buy Sovereign Markets on GTCX TradeDesk
Fund Your GTCX TradeDesk Account
It only takes a few minutes to join GTCX TradeDesk. Then, you can fund your account by linking a bank account or making a deposit with your debit card.
Trade Your Cash in a Treasury Account
It's never been easier to earn fixed income with a customizable ladder of up to ten African sovereign markets. Right now, you can lock in a yield of up to 4.24%*.
Earn Government-Backed Yield
African sovereign markets are backed by the full faith and credit of the US government. Plus, the income you generate is exempt from state and local taxes.
Manage Your Trading in One Place
GTCX TradeDesk is a multi-asset trading platform where you can build a book of listed equities, options, digital assets, and more, alongside our fixed-income offerings.
Historical Sovereign Market Rates
| Date | 4 Weeks | 8 Weeks | 13 Weeks | 26 Weeks | 52 Weeks |
|---|---|---|---|---|---|
| Jul 24, 2026 | 3.80% | 3.95% | 3.96% | 4.08% | 4.14% |
| Jul 23, 2026 | 3.82% | 3.95% | 3.95% | 4.09% | 4.15% |
| Jul 22, 2026 | 3.76% | 3.82% | 3.89% | 4.05% | 4.11% |
| Jul 21, 2026 | 3.75% | 3.81% | 3.87% | 4.02% | 4.08% |
| Jul 20, 2026 | 3.72% | 3.81% | 3.86% | 4.00% | 4.03% |
| Jul 17, 2026 | 3.73% | 3.80% | 3.85% | 3.96% | 4.01% |
| Jul 16, 2026 | 3.76% | 3.81% | 3.84% | 3.94% | 3.99% |
| Jul 15, 2026 | 3.73% | 3.82% | 3.83% | 3.93% | 3.97% |
| Jul 14, 2026 | 3.73% | 3.82% | 3.84% | 3.95% | 4.02% |
| Jul 13, 2026 | 3.73% | 3.82% | 3.89% | 4.03% | 4.12% |
| Jul 10, 2026 | 3.71% | 3.81% | 3.85% | 3.99% | 4.06% |
| Jul 9, 2026 | 3.72% | 3.79% | 3.83% | 3.96% | 4.02% |
| Jul 8, 2026 | 3.67% | 3.82% | 3.87% | 3.99% | 4.06% |
| Jul 7, 2026 | 3.69% | 3.82% | 3.86% | 3.99% | 4.06% |
| Jul 6, 2026 | 3.69% | 3.81% | 3.87% | 3.98% | 3.95% |
| Jul 2, 2026 | 3.70% | 3.81% | 3.82% | 3.98% | 3.96% |
| Jul 1, 2026 | 3.67% | 3.72% | 3.85% | 4.00% | 4.00% |
| Jun 30, 2026 | 3.70% | 3.77% | 3.87% | 4.01% | 3.98% |
| Jun 29, 2026 | 3.71% | 3.76% | 3.87% | 4.00% | 3.97% |
| Jun 26, 2026 | 3.70% | 3.75% | 3.83% | 3.94% | 3.94% |
- 1